by Dr Ulrich Minnaar, Eskom Research Testing & Development
This article provides a benchmark of Eskom’s costs in relation to international electricity prices by reviewing some available literature and data on international electricity prices and placing Eskom’s current prices in context with international electricity prices.
The level of Eskom’s electricity prices is a contentious issue. The significant tariff increases requested by Eskom over the last number of years have taken place in an economically constrained environment with high unemployment and low economic growth. Electricity tariffs have increased significantly above inflation levels over the last decade with a doubling in real prices from 2008-2012 and a further increase of 25% above inflation from 2012-2016. These price increases have, however, come in the context of historically low prices since the 1980s.

Figure 1 illustrates the reduction in real prices from the mid-1980’s till the late 2000’s and the subsequent price increases since 2008. Eskom says that the pricing regime and approved tariffs do not meet the requirements for cost-reflectivity at an efficient operational level. Figure 2 illustrates the shortfall between Eskom’s approved revenues and those required for efficient cost recovery.
Despite this significant shortfall in revenue, which is a key driver for Eskom’s debt, there are valid concerns from customers and stakeholders about what reasonable electricity tariffs are and the relative affordability of Eskom’s electricity tariffs in relation to other countries.

This document provides a benchmark of Eskom’s costs in relation to international electricity prices by reviewing some available literature and data on international electricity prices and placing Eskom’s historic prices in context with international electricity prices.
What does electricity cost around the world?
https://www.statista.com and https://www.globalpetrolprices.com provide us with reliable and easily accessible sources for electricity prices. They maintain records of prices on an ongoing basis and sell this data as part of their product offering to the market.
Statista
Statista provides a relative benchmark of the average electricity prices in 25 countries, illustrated in Figure 3. The benchmarking data is based on a World Energy Council study, “The World Energy Trilemma Index: 2018”.

This dataset indicates prices (October 2018) on a national level at an average price per country ($/kWh). This benchmark indicates that South Africa’s electricity prices are low relative to both developed countries as well as the major developing countries listed – China, India, Indonesia, Brazil and Turkey. The only country in this study which reflects a lower cost of electricity is Argentina, which like South Africa has non-cost-reflective tariffs with estimated subsidies equal to $10 billion.
Globalpetrolprices.com
GlobalPetrolPrices.com maintains its data on an ongoing basis and remains up to date with the latest variations in prices. A local study, conducted by PrimaResearch, used this dataset and the outcomes are discussed below.
Prices across the United States
The US Chamber of Commerce’s Global Energy Institute provides a convenient reference to electricity prices in states across the United States. This data is also available from the Department of Energy; however, the Global Energy Institutes data is conveniently packaged with a reference map. The data covers the last full year of data available, which is 2019 [4].

The US data indicates that the average price across the US is 10,6 c/kWh (US), with the majority of states falling into the nine to ten cents per kilowatt-hour range. Some states, however, pay more than 15 c/kWh [4]. By comparison, Eskom’s 2019 average tariff of R1,10 /kWh translates to 7,6 c/kWh (US) using an average 2019 exchange rate of US$1,00 = R14,45.

Local studies benchmarking electricity tariffs
PrimaResearch study
In August 2019, PrimaResearch released an independent report which took a broad look at various aspects of Eskom’s business. One of the aspects they looked at was the price of electricity.
PrimaResearch made use of the GlobalPetrolPrices.com electricity dataset (2018 year) and concluded the following: “In comparison to a list of 94 countries, South Africa’s electricity prices (at USD 0,14/kwh) was ranked 49th lowest, placing it close to the midpoint of cheap and expensive markets. However, in the cohort of emerging markets, SA’s electricity prices are slightly above average, as can be seen in the chart below. Consequently, we do not think electricity prices are excessive in South Africa.”
It should be noted that they drew this conclusion based on dataset that reflected both Eskom and municipal prices. Their analysis further estimated that in 2018 “the excess profits across all municipalities may have amounted to R8.5-billion. In summary, we think some municipalities may have benefitted from the rising electricity tariff increases, which were unduly borne by consumers. We estimate the excess profits made by the municipalities over the past ten years could have amounted to about R46-billion”.

Lazard
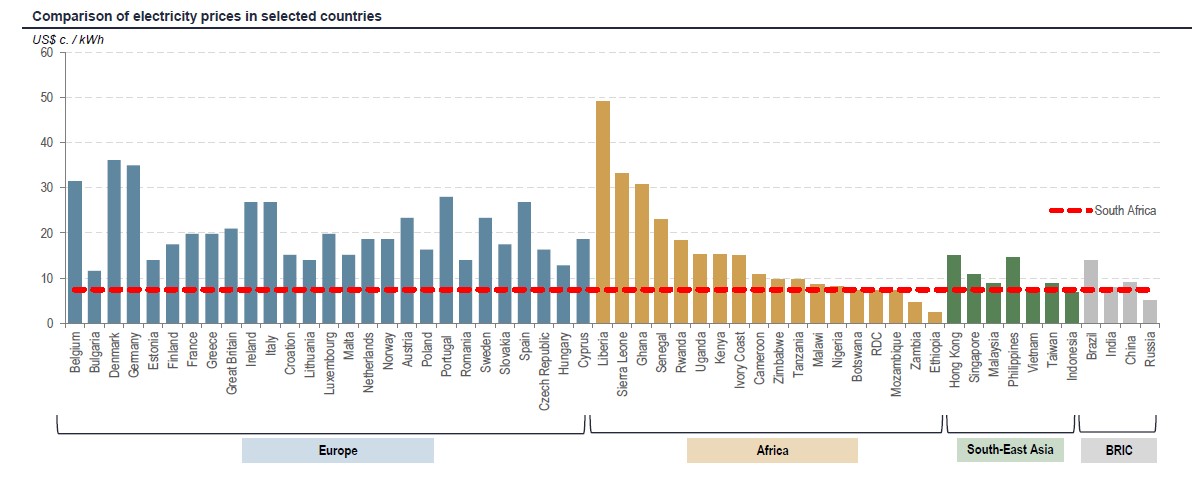
In a 2018 report commissioned for Eskom, Lazard concluded “The average price of electricity in South Africa is below all countries in Europe and South-East Asia. In Africa, the majority of countries have higher electricity prices although a few countries have comparable or even lower prices than South Africa’s” [6].
They further noted that amongst the BRICS countries only Russia had lower prices and that amongst African countries only Zambia and Ethiopia had lower prices. These are two countries with excellent hydropower resources.
Lazard drew several conclusions, including that:
- Eskom tariffs are not cost-reflective, and
- Eskom’s tariffs are low by international standards
World Bank Working Paper 7788
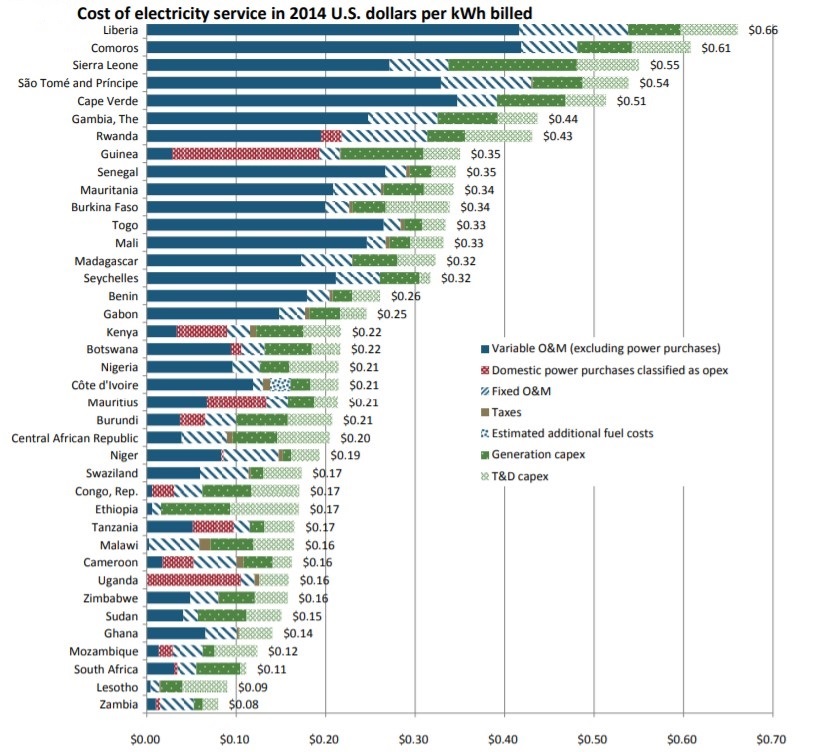
In 2016, the World Bank released Working Paper 7788: Financial Viability of Electricity Sectors in Sub-Saharan Africa. As part of the report, they compared electricity prices across 39 sub-Saharan African countries and concluded that South Africa has the third lowest electricity tariffs.
Nova Economics
As part of an expert opinion submitted in Case Number: 37296/2018 in the Gauteng High Court between Eskom and NERSA prepared by Kay Walsh, Chris Reeders and Ahmed Seedat, of Nova Economics, they touched on a number of local and international benchmarks for electricity tariffs.
Part of their conclusion states:
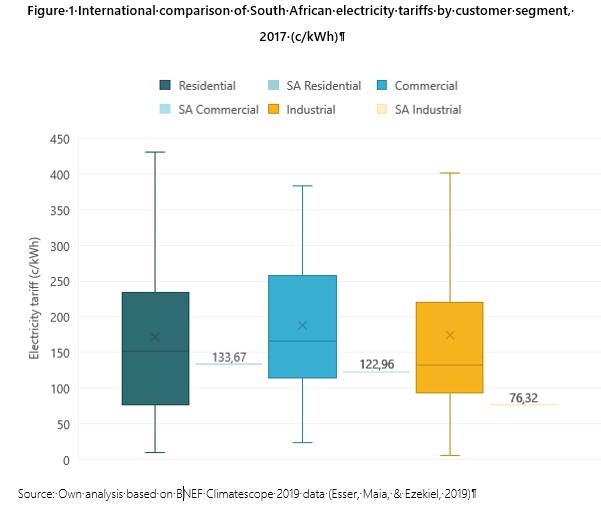
“Our comparison across 100 countries shows that South Africa’s current average electricity price rank competitively across all three of the main customer segments - industrial, commercial, and residential. South Africa’s residential consumers pay an average of 133,67 c/kWh, which is a lower tariff than more than half (53 of 100) the countries surveyed. South Africa’s commercial and industrial electricity tariffs are more competitive by international standards. South Africa’s average commercial tariff of 122,96 c/kWh is cheaper than 71 of the 100 countries surveyed, while industrial tariffs (76,32 c/kWh) are among the lowest 20. In support of this analysis, we also presented the results of two other international electricity tariff comparisons (by the World Bank and International Energy Consultants) which confirm that South Africa’s average electricity prices remain very competitive by international standards. Finally, we compared Eskom’s current average tariff to a local benchmark for the price of future electricity generation capacity – the ‘least-cost’ scenario (IRP 1) presented in the IRP 2019. Our analysis shows that based on recent IRP estimates a hypothetical new market entrant, operating a newer, more efficient, ‘least-cost’ generation fleet consisting mainly of wind, solar PV and gas would require a tariff 40% to 50% higher than Eskom’s current tariff to cover its costs. In contrast to NERSA’s claim, we conclude that the approved tariff is not cost-reflective and is not sufficient to ensure Eskom’s financial viability.”
A look at the most recent international price data
A look at the most recent data available from the International Energy Agency (IEA) for comparison provides a similar picture of the relative affordability of Eskom’s electricity tariffs as those presented by other studies discussed above.
Eskom’s prices for 2019 are placed in relation to an international comparison conducted annually by the UK National Statistics Department of Business, Energy & Industrial Strategy. This compares electricity tariffs for industrial and domestic customers for the fifteen major EU countries and a sample of other countries across the IEA. The IEA data collected by UK National Statistics is converted to US cents/kWh based on exchange rate data collected by UK National Statistics and benchmarked against Eskom’s 2019 tariff data (converted to US cents/kWh) as published on its website and the 2019 Annual Report. This dataset is used as it is updated and maintained by a credible source (UK National Statistics) on a quarterly basis.
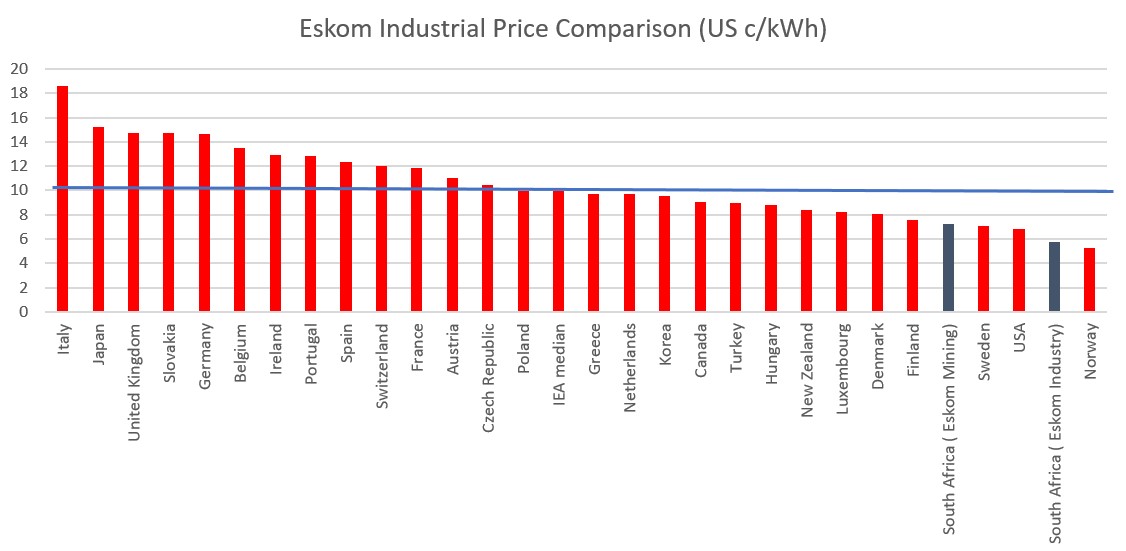
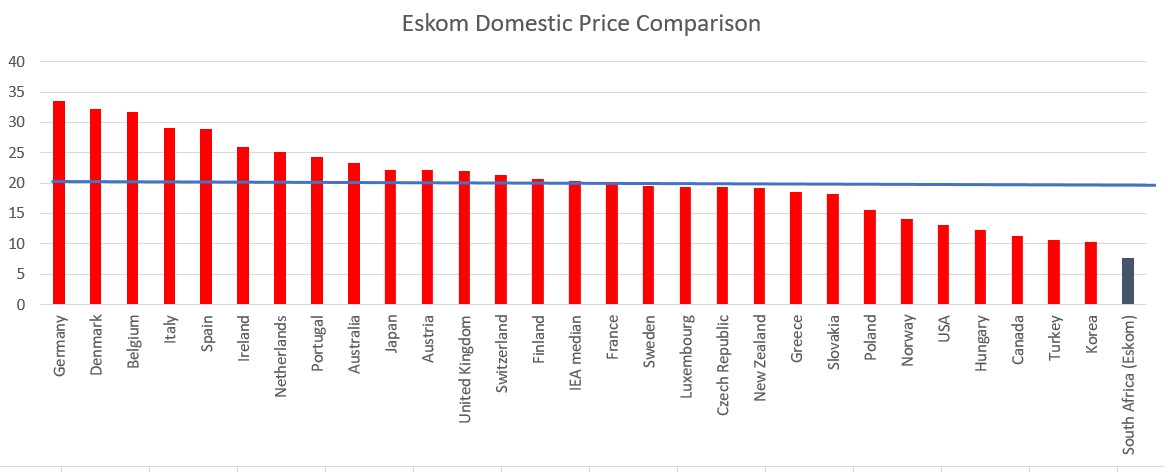
Figures 10 and 11 illustrate that relative to the sample of IEA benchmarked in this study, Eskom’s prices for industrial and domestic customers are amongst the lowest in the sample, with only Norway’s industrial electricity price being lower than Eskom’s.
Historic price analysis – industrial sector
While Eskom’s prices have increased significantly above inflation over the last decade, an international comparison that considers both the most recent available prices as well as the historic trend provides insight into how Eskom’s prices have changed relative to the international market. This is particularly relevant for the industrial sector in South Africa, where commodities and inputs costs are often dollar denominated or indexed. A dollar-based comparison of electricity as an input cost across countries gives a picture of Eskom’s (and by extension South Africa’s) international price competitiveness as an electricity supplier.
The same 27 country IEA dataset sourced via UK National Statistics is used for this analysis. The data used is tabled in Appendix A. This price data is compared to the historic price increase data stored and documented by Eskom’s Pricing Department and publicly available on the Eskom internet as the “Historical Average Price Increase” spreadsheet. This dataset contains sales volumes, average prices per categories and price increases dating back to 2003 and is updated and made publicly available annually by Eskom Pricing. The comparison is made in US cents/kWh with the Eskom prices for each year converted to a particular year’s US dollar equivalent using the annual average exchange rate data published by Nedbank.

Figure 12 illustrates the historic prices (dollar denominated) for Eskom’s mining and industrial customers (highlighted by diamond markers) going back to 2003. The era of low electricity pricing in South Africa is clearly visible with Eskom’s industrial price being ~75% below the IEA average until 2009, with a significant increase from 2009-2011. The price margin has been gradually declining since 2009 and by 2019 (Eskom’s 2019/20 financial year), Eskom’s average industrial electricity price was ~47% lower than the IEA average industrial price, with only Norway being competitive with Eskom’s average industrial pricing.
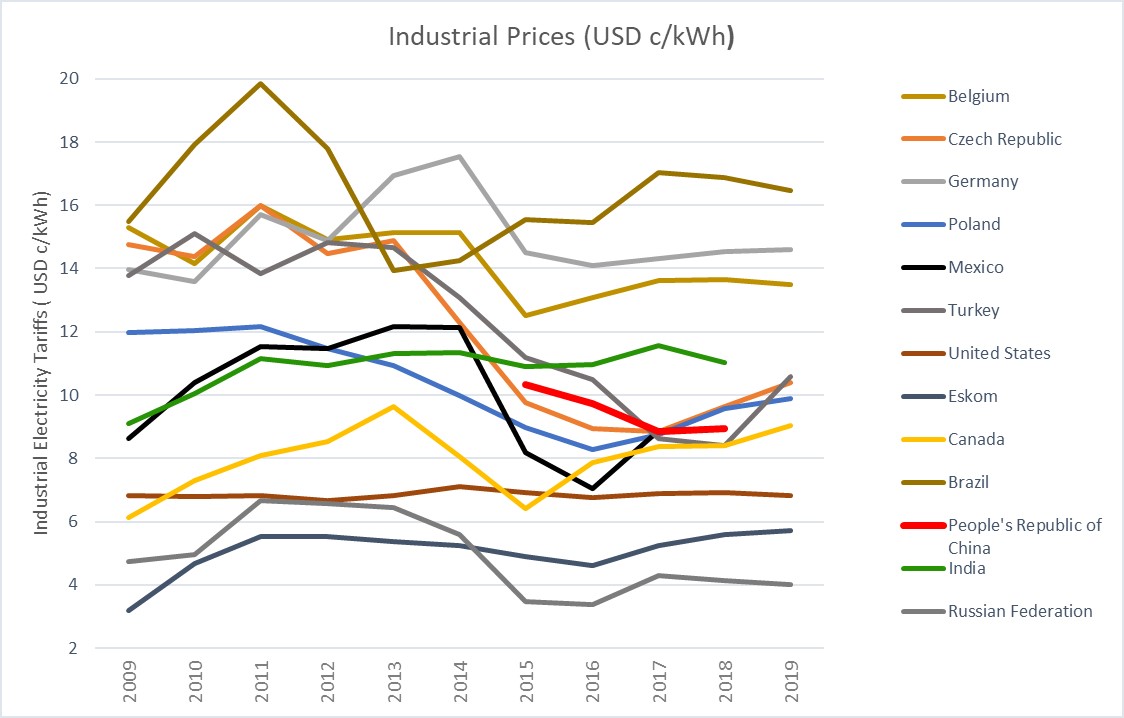
A second observation is that in dollar terms, Eskom’s industrial prices have been largely flat since 2011. In fact, between 2011 and 2016 they decreased before rising again until 2019. Between 2011 and 2019, Eskom’s dollar denominated industrial electricity price rose by 3,7% from US 5,53 c/kWh to US 5,73 c/kWh. A similar pattern is seen for mining, which saw steep increases between 2009-2011. Tariffs between 2011 and 2019 increased by 9,07% from US 6,62 c/kWh to US 7,72 c/kWh.
A slightly broader historic comparison
For this analysis the dataset utilised is taken from the IEA Energy Prices and Taxes Statistics database. This dataset contains historic electricity price data for industrial and households for a sample of 36 countries from 2009-2019. This price data is compared to the same historic price increase data stored and documented by Eskom’s Pricing Department and publicly available on the Eskom internet as the “Historical Average Price increase” spreadsheet [10].
As above, the comparison is made in US cents/kWh with the Eskom prices for each year converted to that year’s US currency using the annual average exchange rate data published by Nedbank. The root source for this data set is essentially the same as that used earlier, however this data is differentiated in two ways:
- It contains more countries, hence broadening the comparison while simultaneously being over a shorter period.
- This data is only available via a subscription service to either the IEA or the Organisation for Economic Co-operation and Development (OECD), meaning it’s not necessarily available to all interested parties or stakeholders. It was thus deemed prudent to start the analysis with the data obtained from UK National Statistics and add the OECD/IEA data analysis as an additional analysis for the sake of completeness.
Industrial prices
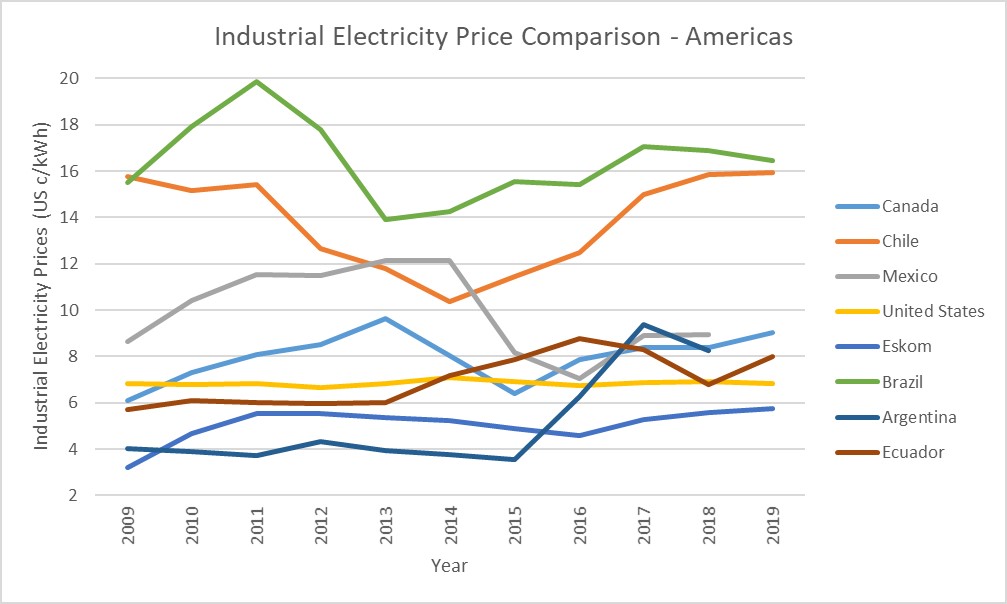
A look at Eskom’s industrial prices relative to a small sub-set of the IEA dataset confirms the observation of Eskom’s industrial prices being relatively low in dollar terms.
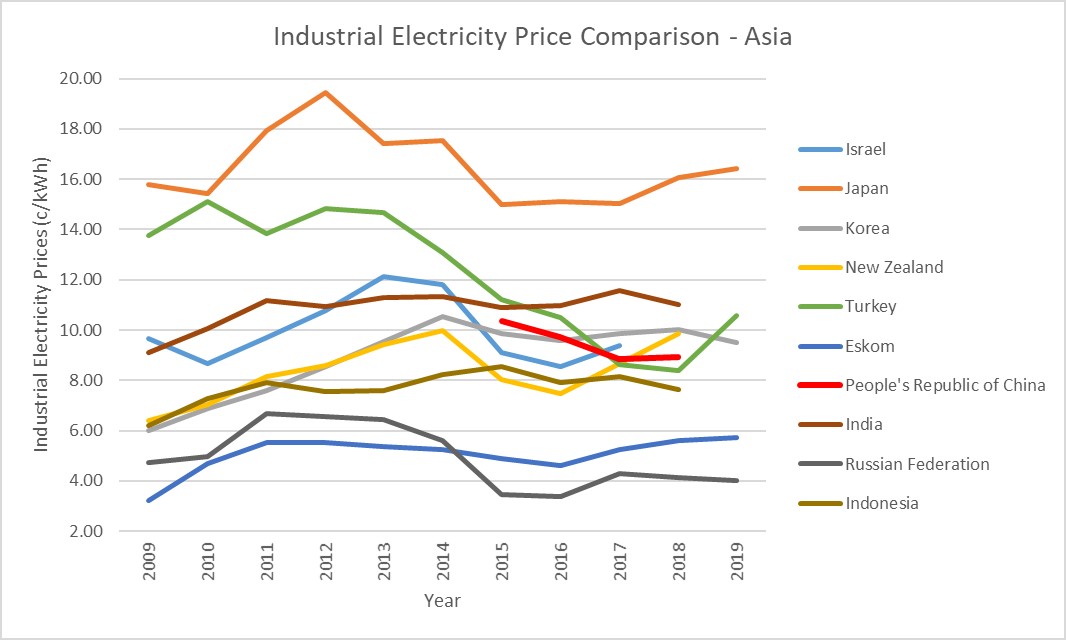
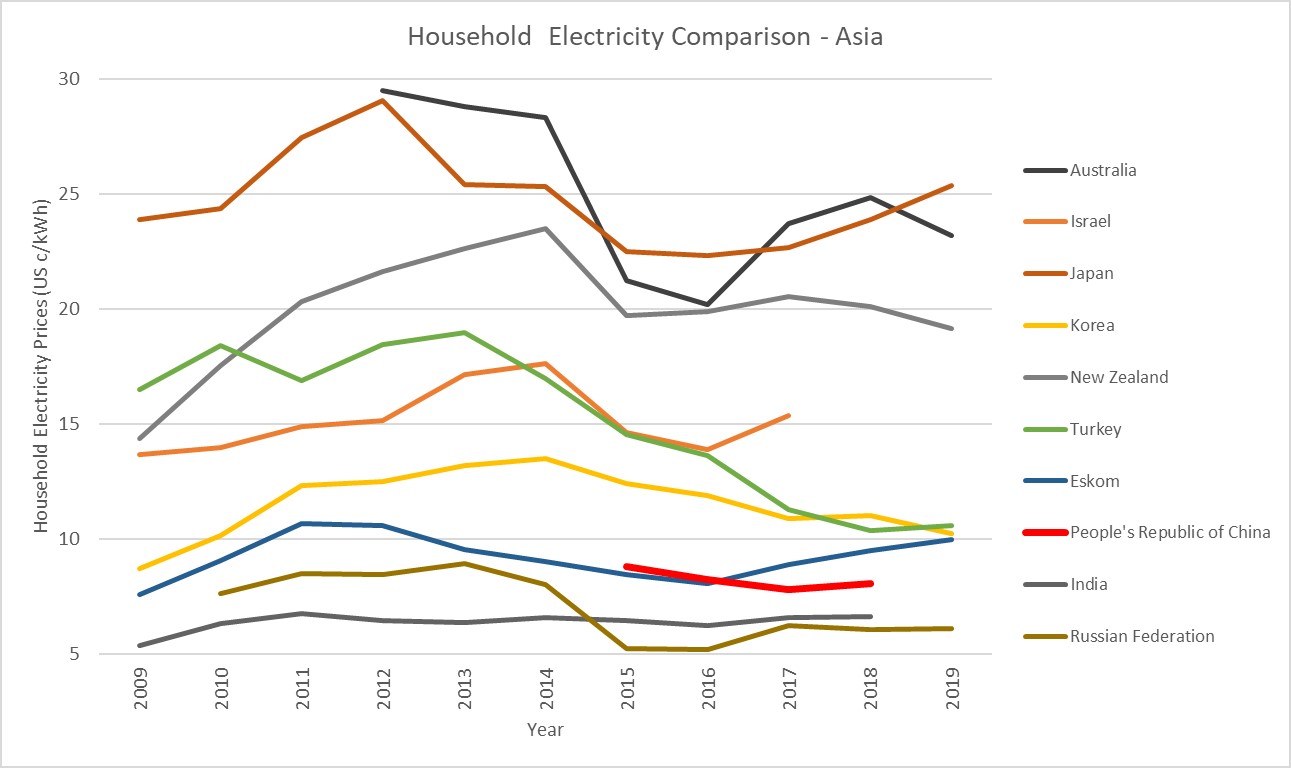
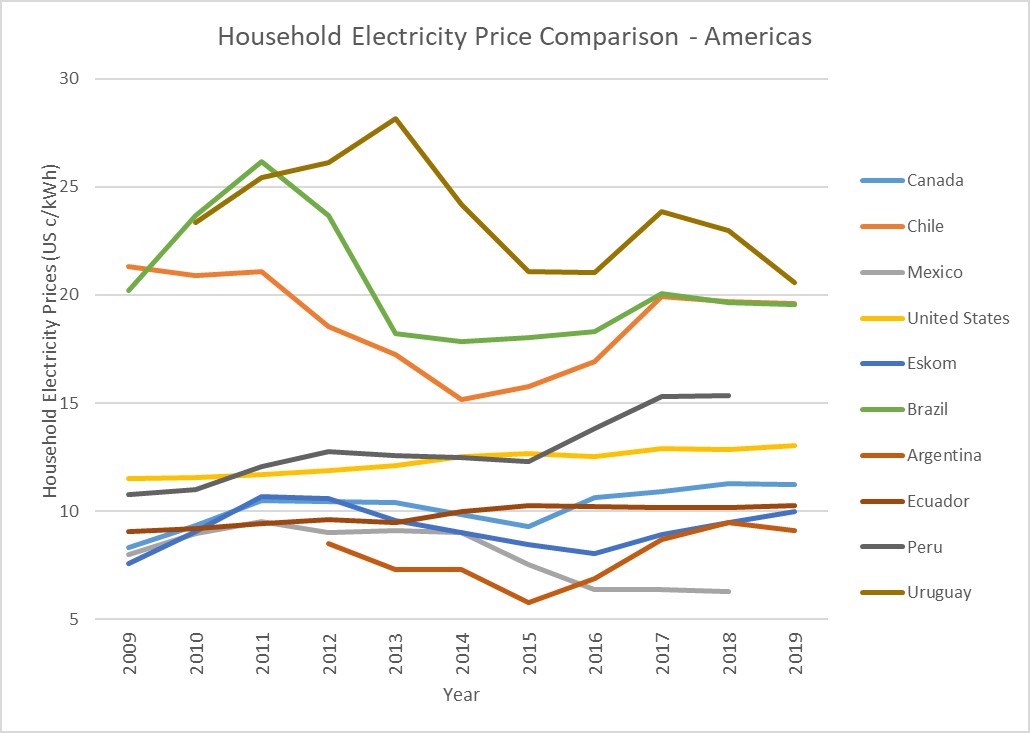
Since the IEA dataset is dominated by European countries, Figure 14 simply serves to illustrate price comparisons to other regions, which in this instance have been loosely defined as the Americas and Asia.

Improved visualisation of the data
While the graphs above provide an overview of historic prices, they have limitations in terms of the way the data is visualised, as the graphs become messy and unclear as the number of countries increase. This was improved by visualising the data on a web-based dashboard utilising the Plotly and Dash toolbox based in the Python programming language. The resultant visualisation included a series of animated choropleth maps. Data was visualised for both the full IEA dataset comprising over 70 countries and complemented with the latest data published by Bloomberg New Energy Finance (BNEF).
A closer look at tariffs in China
Industrial prices
China is an important market for consideration, due to the massive growth in industrial development over the last two decades. A key point raised is that low labour and energy costs (e.g. low electricity tariffs) is a key component of the Chinese policy that has driven this trend. It is assumed and often taken for granted by many analysts that energy prices follow the same trend and that electricity costs in China are low, without a detailed look at the available data.
However as far back 2015, Biggins Lacy Shapiro & Co.[1] (BLS), in co-operation with Asia-based firm, Tractus Asia[2] (Tractus) noted that US industrial electricity tariffs were lower than Chinese tariffs [13].
[1] Biggins Lacy Shapiro & Co is a consulting firm focused on location economics that assists some of the world’s largest corporations identify the best locations, secure incentives, obtain development approvals and optimize energy strategies. https://blsstrategies.com/
[2] Tractus Asia is a strategy consulting firm that assists multinational companies make strategic decisions regarding where to locate and how to structure direct investments in Asia. https://tractus-asia.com/
BLS and Tractus conducted a tariff benchmark for industrial customers based on interactions between BLS and a range of utilities in the US, while Tractus consulted China’s Grid State Corporation in a range of provinces and municipalities across China. BLS and Tractus reviewed the estimates to ensure consistency in comparisons and included “commodity charges, transmission and distribution/delivery charges, taxes and societal benefit fees (such as programmes for conservation, renewal energy, etc.)”. In terms of methodology, the list of assumptions is included in Figure 20.

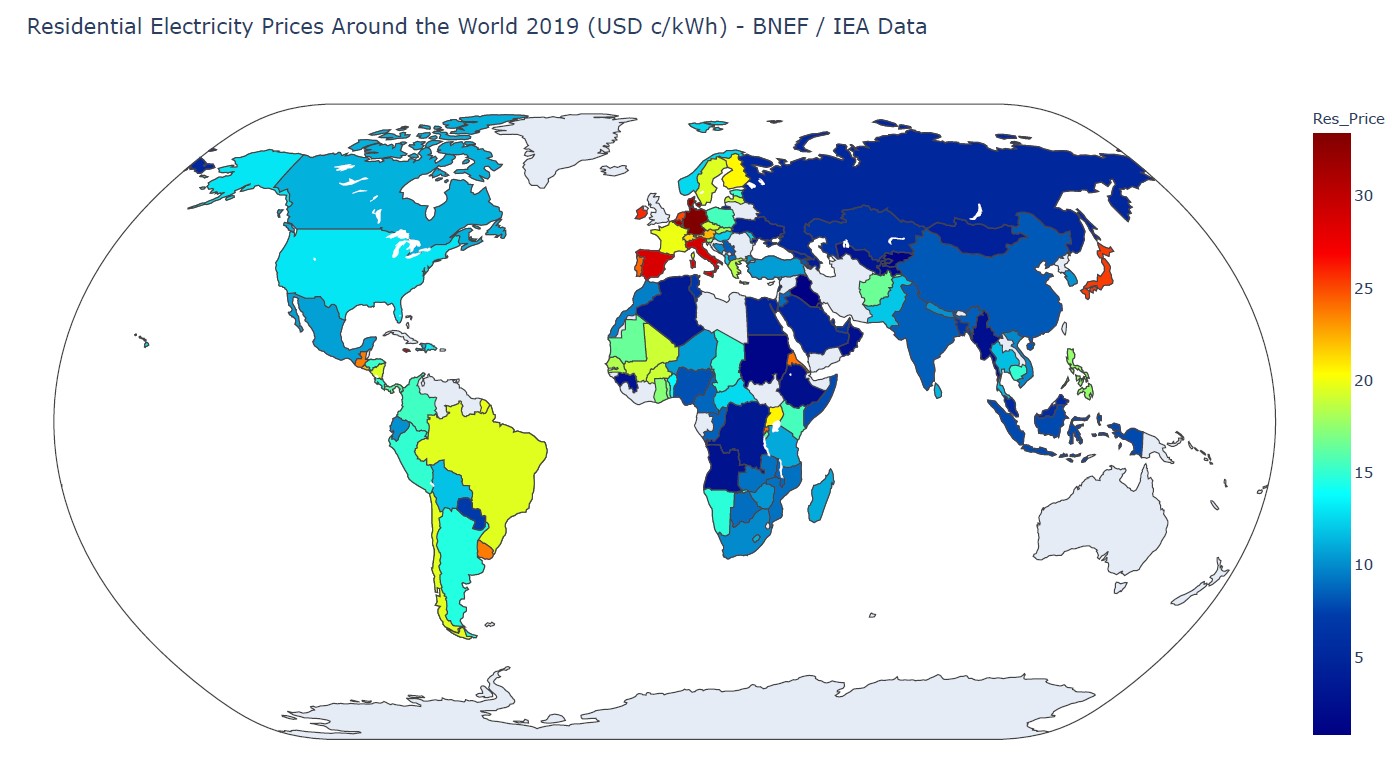
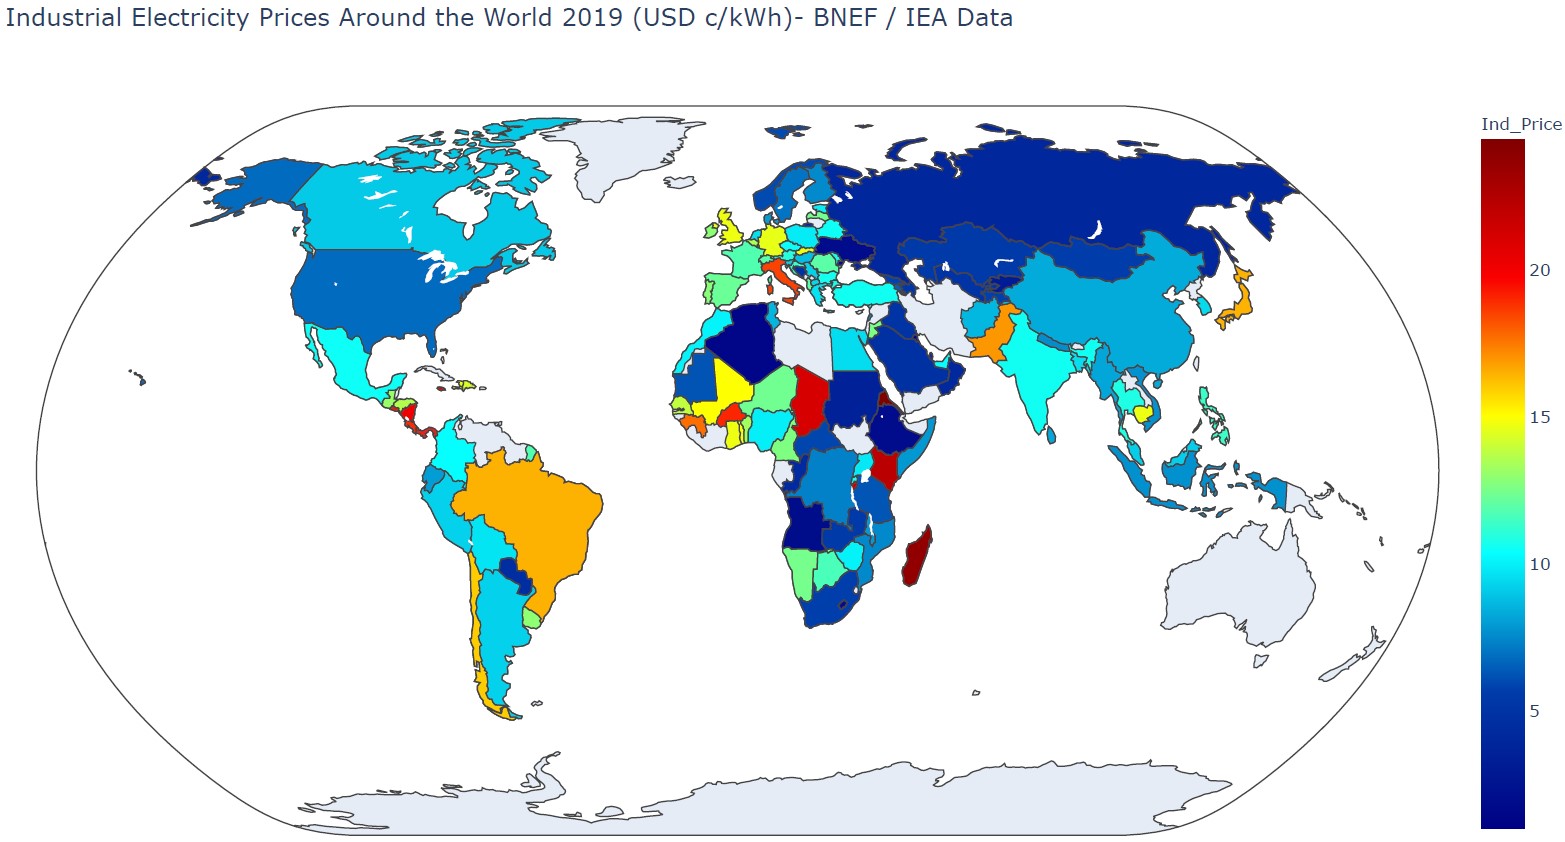
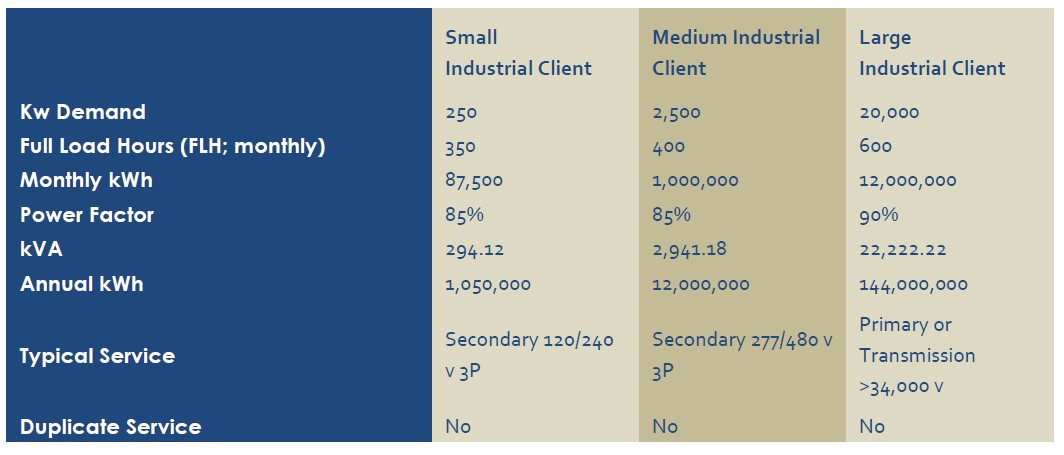
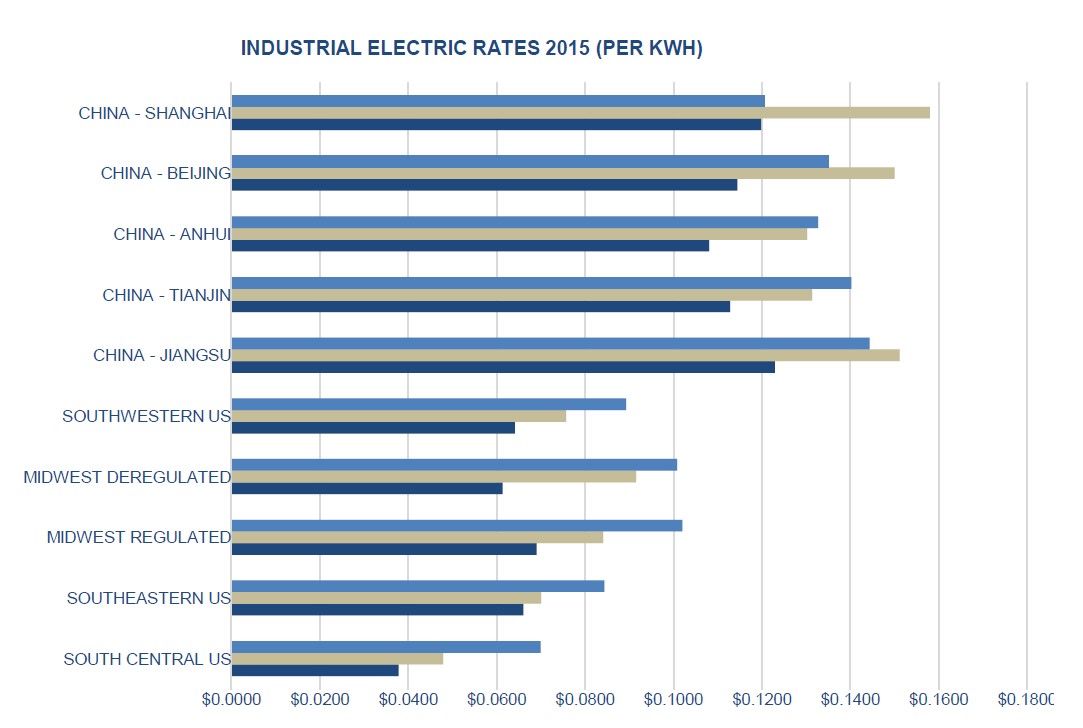
Figure 21 shows that electricity costs are significantly higher for industrial customers in China than in the US. This holds for small, medium and large customers across locations between the customers. The authors note “…median electricity prices for industrial loads in the U.S. tend to be 34-49% lower than Chinese prices, with point-to-point comparisons varying between a 15% and 70% savings in the U.S. In other words, Chinese industrial electric prices tend to be materially higher than those in the U.S…”.
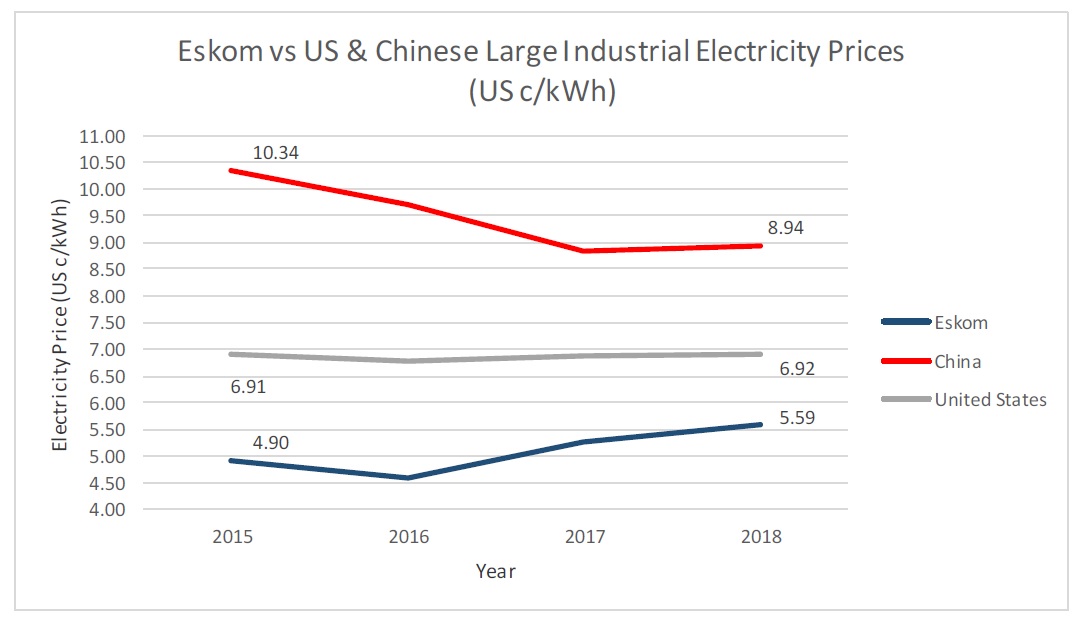
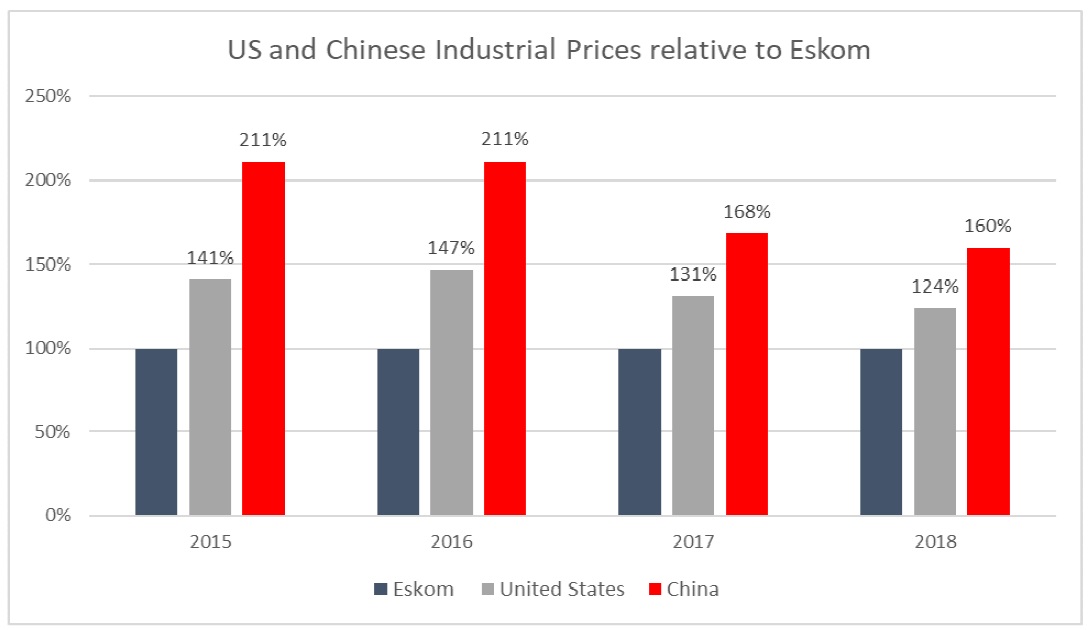
The results from the BLS and Tractus comparative study are corroborated by the IEA data illustrated earlier that Eskom’s average industrial prices are lower than US prices and significantly lower than Chinese tariffs for large industrial customers. A closer look at the prices for Eskom, the US and China over the 2015-2018 period is illustrated in Figure 20.
Figure 23 plots the same data with US and Chinese industrial prices as a percentage relative to Eskom’s industrial prices for large power users. Figures 22 and 23 illustrate that electricity prices for large industrial customers in South Africa were less than half the average rate in China during 2015/16 but these have subsequently narrowed in 2018, while still being significantly lower.
Small and medium industrial customers
For more detailed information on tariffs for smaller industrial customers in China, data is used from an online briefing provided by Dezan Shira & Associates. This briefing provides data on a regional breakdown of average electricity cost for small and medium sized industrial customers (called general industrial power rates) per voltage level per region in China in 2018. For this analysis the tariffs for customers connected at 10 kV is used. The Chinese Yuan-US Dollar exchange rate used is 1 RMB = US$0,145.
Average costs for industrial users for Eskom and local municipalities are taken from Eskom Pricing’s municipal comparison model, maintained by the Pricing Department, which builds average costs from the individual tariff. Comparisons are made based on prevailing exchange rates, voltage level and typical consumption rates for Eskom customers.
The municipal comparison model calculates summer and winter tariffs for Eskom and local municipalities. The average tariffs are calculated as a weighted average between summer and winter tariffs for municipalities and Eskom. For Eskom, the Miniflex tariff is used. The municipal comparison model is built with 2020 tariff data in South Africa and these tariffs are compared to Chinese tariffs in 2018. The comparison is done assuming tariffs have remained stable in China. While the comparison for municipal tariffs vs. Chinese tariffs are only indicative, Eskom’s Miniflex tariff is plotted for 2018 and 2020. For the Eskom 2018 the tariff is scaled according to approved MYPD tariff increases between 2018 and 2020.
The results of the comparative analysis for Eskom, South African municipalities and average Chinese regional prices for general power users are shown in Figure 23. For small and medium industrial customers, Eskom’s tariffs would rank fourth lowest amongst Chinese regions and below the national average rate for customers connected at 10 kV. Eskom’s tariffs for 2018 and 2020 are 16% below the national average for China in 2018.
Indicatively, tariffs for South African municipalities can be seen to be competitive with Chinese tariffs for industrial users for some of South Africa’s larger metropolitan municipalities, namely Nelson Mandela Bay, Tshwane, City of Cape Town and Ethekwini. Figure 24 also shows municipalities with high to very high tariffs relative to Chinese rates, for example Emfuleni, Matjhabeng and Sol Plaatjie industrial rates can be considered very high and uncompetitive relative to Chinese industrial rates.
Household prices
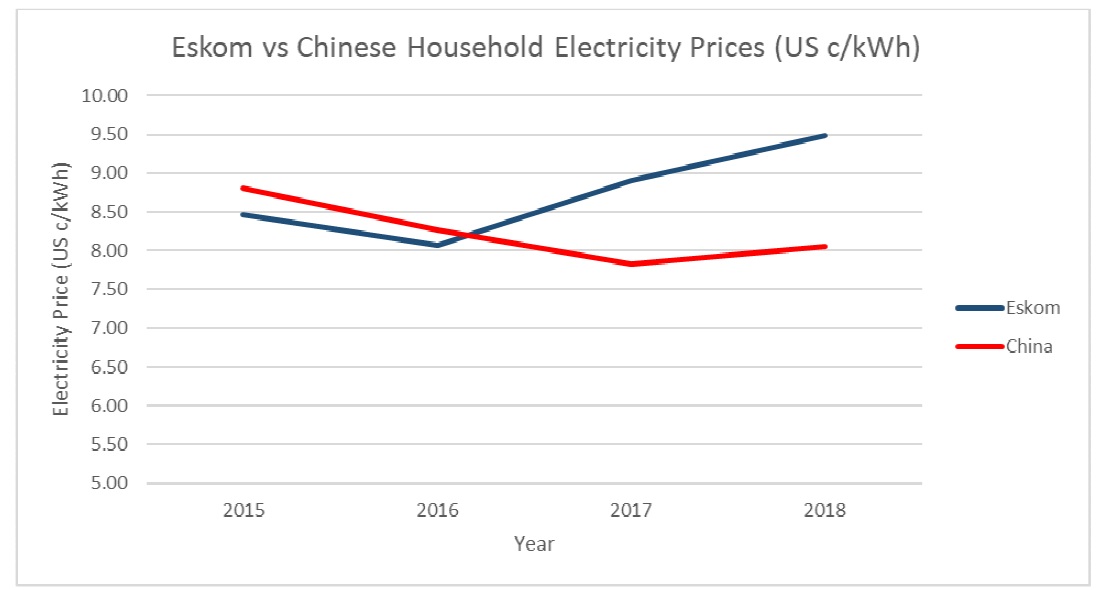
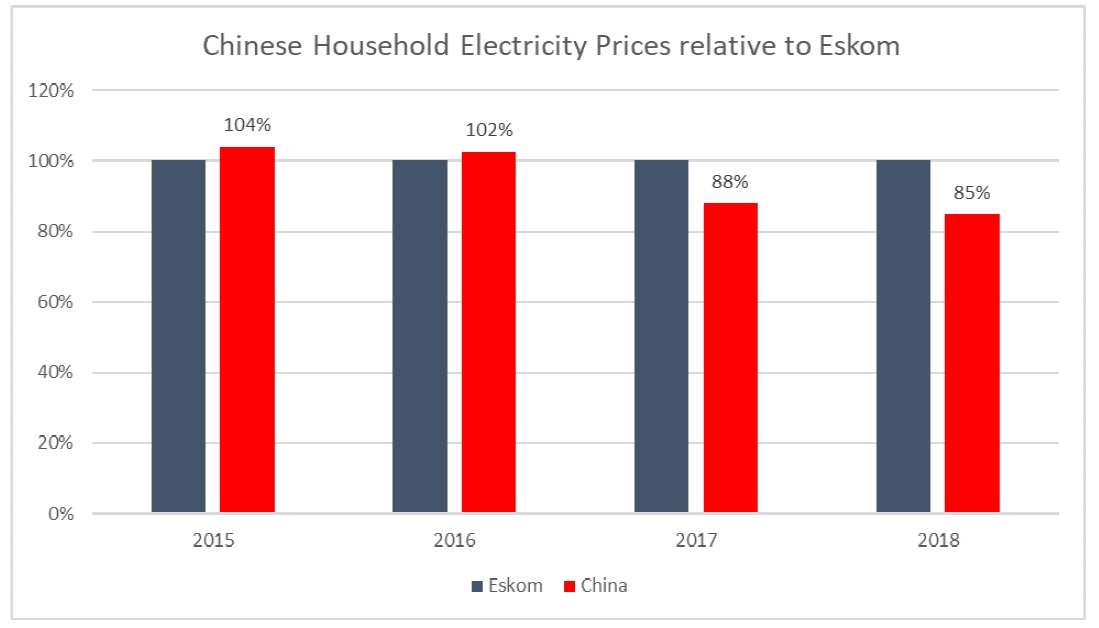
A direct comparison between household electricity prices in China vs. Eskom’s prices, as shown in Figure 23, indicates that, while Eskom’s prices were slightly below those in China in 2015, they are now higher.

Conclusions
This work has reviewed several local and international data sources and studies comparing Eskom’s electricity prices to international benchmarks. The available body of work, including data and analysis, conducted by several local and international companies and organisations, all independent of Eskom is reviewed. The results presented are self-explanatory and the conclusions reached across the board benchmarking Eskom’s prices conclude that Eskom’s overall and per sector tariffs are either competitive or low by international standards.
Data from 27 countries from the International Energy Agency for 2019 is analysed using an IEA comparison run by the UK government and it is found that Eskom’s prices for domestic, industrial are significantly lower than the median IEA countries in the comparison. The IEA data sample was extended to include developing countries and BRICS countries. The analysis was further extended to provide a historic comparison of Eskom prices over time and the results presented indicate that relative to the IEA sample Eskom’s tariffs have remained low in dollar terms.
Bibliography
[1] N. Sönnichsen, “Electricity prices in selected countries 2018,” 20 August 2020. https://www.statista.com/statistics/263492/electricity-prices-in-select….
[2] Globalpetrolprices.com, “Electricity prices,” [Online]. Available: https://www.globalpetrolprices.com/electricity_prices/.
[3] World Energy Council, “https://www.worldenergy.org/,” 2018. [Online]. Available: https://www.worldenergy.org/assets/downloads/World-Energy-Trilemma-Inde…. [Accessed 27 October 2020].
[4] Global Energy Institute, “https://www.globalenergyinstitute.org/,” 2019. [Online]. Available: https://www.globalenergyinstitute.org/average-electricity-retail-prices…. [Accessed 27 October 2020].
[5] PrimaResearch, “PrimaResearch,” 5 August 2019. [Online]. Available: https://primaresearch.co.za/essential_grid/shedding-light-on-eskom/. [Accessed 27 October 2020].
[6] Lazard, “Report Extract "Electricity Prices in South Africa are Low by International Standards",” Lazard report submitted to Eskom, 2019.
[7] C. Tremble, M. Kojima , I. Arroyo and F. Mohammadzadah, “Financial Viability of Electricity Sectors in Sub-Saharan Africa: Quasi-Fiscal Deficits and Hidden Costs, Policy Research Working Paper 7788,,” World Bank Group, 2016.
[8] K. Walsh, C. Reeders and A. Seedat, Response to the expert opinion set out in the affidavit by Dr Hawthorne in relation NERSA’s decision on Eskom’s tariff application for 2018/19, Expert Opinion in Case 37296/2018, Gauteng High Court, South Africa, 2019.
[9] Department for Business, Energy & Industrial Strategy, Uk National Statistics, “International energy price comparison statistics,” September 2020. [Online]. Available: https://www.gov.uk/government/collections/international-energy-price-co…. [Accessed 27 October 2020].
[10] Eskom, “Historical Average Price Increase,” [Online]. Available: https://www.eskom.co.za/CustomerCare/TariffsAndCharges/Documents/Histor…. [Accessed 2021 January 20].
[11] Nedbank, “Annual Average Exchange Rates - Nedbank,” 2020. [Online]. Available: https://www.nedbank.co.za/content/dam/nedbank/site-assets/AboutUs/Econo…. [Accessed 20 JAnuary 2021].
[12] International Energy Agency (IEA), “IEA (2020), "End-use prices: Energy prices in US dollars (Edition 2019)", IEA Energy Prices and Taxes Statistics (database), https://doi.org/10.1787/3a972835-en (accessed on 20 January 2021).,” 2020.
[13] Biggins Lacy Shapiro & Company, LLC / Tractus Asia Limited, “A Comparison of US & China Electricity Costs,” 2016. [Online]. Available: https://blsstrategies.com/docs/news/News_181.pdf. [Accessed 05 March 2021].
[14] Z. Y. Zhang, “China Electricity Prices for Industrial Consumers,” China Briefing, 23 April 2019. [Online]. Available: https://www.china-briefing.com/news/china-electricity-prices-industrial….. [Accessed 03 March 2021].
[15] Bloomberg New Energy Finance, “Climatescope by BNEF,” September 2021. [Online]. Available: https://global-climatescope.org/. [Accessed 8 September 2021].
Send your comments to rogerl@nowmedia.co.za
