by Charmaine Mathopo and Ulrich Minnaar
The electricity structure in South Africa is largely vertically integrated, with the national utility, Eskom, responsible for the bulk of generation electricity (90%) (alongside independent power producers (IPPs)), as well as owning and operating the transmission network. Distribution is split between Eskom and municipalities (redistributors) with Eskom supplying about 50% of distribution customers in the country and the rest supplied by approximately 180 local municipalities [1]. The remaining electricity is sold in bulk to municipalities which distribute it to other end-users [2]. Figure 1 illustrates the structure of the South African electricity supply industry.

Municipal and Eskom electricity prices are regulated by the National Energy Regulator of South Africa (NERSA); however electricity prices still differ in each municipality because each can apply for an additional increase on the NERSA recommended electricity price and above the Eskom tariff increase [2]. Even with the possibility of applying for an additional tariff increase, tariffs must comply with the Distribution Tariff Code of South Africa. Both Eskom and municipal electricity tariffs should provide a means to recover the costs incurred by the distributor to supply electricity. This is done to ensure business financial viability but can only be done within certain limits. As far back as 2004, Steyn reported that distributors of electricity could make 10-20% of profit from selling electricity with average technical losses of 10%.
The division of municipal customers between Eskom and municipalities is a contentious issue within the South African electricity supply industry for various reasons. These include:
- The large number (about 180) of municipalities with individual tariff structures and levels
- High levels of debt municipalities owe to Eskom
- The assertion by the South African Local Government Association (SALGA) that municipalities have exclusive rights to reticulate electricity within their boundaries
- Cross-subsidisation of other services using electricity revenue in municipalities
Amongst the key differentiating factors between municipal electricity distribution and sales from Eskom is:
1) Municipalities cross-subsidise other municipal services with electricity revenue, whereas Eskom does not:
"The revenue generated from electricity is used to cross-subsidise other municipal services. The distribution of electricity by Eskom with municipal jurisdictions leads to a loss of revenue or an opportunity to generate revenue from the distribution of electricity for municipalities." [4]
2) NERSA follows different methodologies to determine tariffs for Eskom vs. municipalities. Eskom revenue and tariffs are determined using the multi-year pricing determination (MYPD) methodology which requires cost-to-serve studies to be conducted. Municipalities in contrast have tariffs approved via the Determination of the Municipal Tariff Guideline and Revision of Municipal Tariff Benchmarks guideline which use benchmarking to determine tariffs. This methodology has recently been declared illegal by the courts.
These differences between Eskom and municipalities mean there is a significant divergence between Eskom tariffs and municipal tariffs as well as between municipalities. This report provides exploratory analysis and high-level benchmarking of Eskom and municipal tariffs, municipal mark ups and average prices amongst customers.
To provide an understanding of the municipal electricity price benchmark, their electricity prices are compared to the Eskom electricity price and to other municipalities. These municipal electricity prices are also compared to the debt owed to Eskom by the municipalities, to determine the link between the municipal electricity price and the municipal electricity debt to Eskom.
To determine the benchmark of municipal electricity prices, the 2020/21 P9114 data from StatsSA [5] and the 2021 Redistributors data from Eskom was used. The municipal price was determined by dividing the total amount used by the municipality to purchase electricity by the total consumption for that municipality. The electricity price paid by the customers was determined by dividing the total electricity sales amount for each municipality by the total consumption for that municipality. All the purchases and sales amounts were obtained from the 2020/21 P9114 data, while the consumption data was obtained from the Eskom redistributor’s data. The two datasets contained different municipalities with the redistributor’s data having separate entries for different municipal regions. To ensure that the data overlapped, the consumption values for regions in each municipality were summed and the municipalities in each dataset compared. The number of municipalities in each province per dataset is shown in Figure 2. The redistributor’s data had 172 entries after summing all the regions per municipality while StatsSA 2020/21 P9114 data contained 300 municipalities with 124 of these municipalities having R0 entry for electricity sales. The municipalities that were not found in both datasets and those having R0 for electricity sales were then excluded from the analysis. This process resulted in only 132 municipalities being sampled, with most of the sampled municipalities being from the Western and Northern Cape as shown in Figure 2. To compare municipal overdue debt levels, the overdue debt dataset from Eskom was used.


Municipal electricity pricing models
Electricity revenue is an important source of revenue generation to local municipalities. Figure 4 shows the breakdown of revenue sources for municipalities in South Africa and shows the split for metros and secondary cities.

From Figure 4 it can be seen that electricity revenue is the largest source of revenue available to municipalities and accounts for 29.6% of municipal revenue. This contribution is even higher for metros at 32,7% and secondary cities at 37,5%.
NERSA determines the annual electricity price increase that municipalities can apply to their electricity prices. Municipalities can also apply for their own price increase in addition to the NERSA recommended price. Historically it was suggested that only 10-20% of profit be made by municipalities from selling electricity at 10% energy losses on average [2]. Even with these rules and recommendations in place there are still municipalities that make a profit that is higher than the recommended 20%. This has caused large disparities to occur between municipal electricity prices.
While the revenue (and by extension markup) and debt data in this study is based on actual values, estimates of average electricity prices are dependent on knowledge of losses on municipal networks. A key factor in this study is that the estimates of municipal prices are done without detailed data of losses within each individual municipality. Internationally losses are considered to be managed efficiently if they are less than 10%. Anecdotally, evidence exists that many municipalities have loss levels that significantly exceed this; an example of this is shown in Figure 5. Similar to the range of values in markups on electricity sales, it is likely that a large range exists in terms of losses between municipalities. Well-performing municipalities with urban networks can have losses below 10% (even as low as 5%) and really poorly performing municipalities may have losses at 25% or even higher.

Figure 6 shows the calculated average electricity price for local municipal customers at 10% losses and the NERSA approved prices. The tariffs shown are for customers in the Inclined Block Tariff, who are prepaid customers and are shown as R/kWh. It can be seen in Figure 6 that in five of nine provinces, the NERSA price is more than the calculated electricity price that customers pay. This may be as a result of the calculated customer electricity prices not considering the non-technical losses experienced by the municipalities. To confirm this, a comparison of NERSA approved prices and calculated electricity prices for the metropolitan municipalities whose losses are shown in Figure 5 is shown in Figure 7.


In the 2020/21 financial year municipalities spent R95,1 billion on electricity purchases and sold it to their customers for R118,1 billion. Municipalities made R23 billion in markups on electricity sales which covers their profit and operating costs [5]. Figure 8 shows the average markup that municipalities made per province per kWh. It shows that the province which had the highest markup on average in 2020 was the Western Cape and that the average markup on electricity sales for municipalities was 1,75 on electricity sold, significantly higher than the next highest province, which is the Northern Cape with an average markup of 1,25.

A breakdown of municipalities with the highest markup is shown in Figure 9 which have markups ranging from 1,5 to 2,5. The Theewaterskloof municipality in the Western Cape has the highest mark up at 2,5. With the exception of Erkurhuleni, the other 9 municipalities are all in the Western Cape.

Twenty-nine percent (36) of the 131 municipalities that have been sampled for 2020 have an electricity price markup that is less than one, these are shown in Figure 10. One (2,8 %) of these municipalities is in Gauteng, 15 (41,7 %) are in the Free State and 20 (55,6 %) are in the Eastern Cape.

The Eastern Cape has the lowest average electricity price markup of the nine provinces. This is indicative of the amount of electricity purchased by customers being much lower than the electricity purchased by the municipality from Eskom; this also shows that the municipalities in the province may be incurring significant losses from electricity sales. Dilapidated electrical infrastructure and illegal tampering by consumers are among the reasons listed for the losses experienced by some municipalities in the province, such as the Great Kei municipality, which has the lowest markup in the province as shown in Figure 11 [9].

Figure 12 shows the general spread of municipal markups for municipalities in each South African province with all outliers removed. It confirms the disparities that exist within municipal electricity prices in South Africa. The Northern Cape Province had the largest spread of electricity price markups in 2020, which ranged from 0,45 to 1,61, with more than half of the municipalities having a markup less than 1,1. The Western Cape and Gauteng provinces are shown to not have any municipalities with negative markups; this is true for the Western Cape but for Gauteng, only two municipalities have a negative markup which are not shown as they are outliers.

Municipal overdue debt to Eskom
The total overdue debt to Eskom by municipalities in 2020 was R28 billion (excluding interest), which represents an increase of over 60% from 2019. A significant number of municipalities are unable to distribute electricity effectively due to a maintenance backlog that has resulted in deteriorated networks [10]. Of the R28 billion of the average municipal debt to Eskom, R10,6 billion, which is 34% of the total debt, was owed by the municipalities in the Free State as shown in Figure 13. According to a working paper by the Development Bank of South Africa, the reason for an increase in municipal electricity debt can be partly attributed to the decline in electricity sales. The paper further states that more consumers are investing in energy efficient appliances and towards embedded generation such as solar PV systems which could be another reason for the decrease in electricity sales [11].
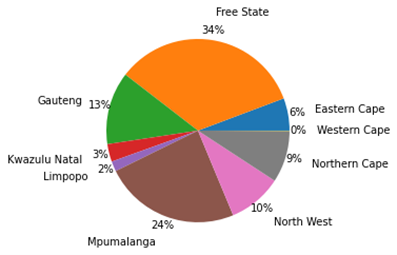
Municipal debt is a moving target that is continuously growing; more recent data puts municipal debt to Eskom at about R60 billion.
Comparison of municipalities’ overdue debt and their electricity prices
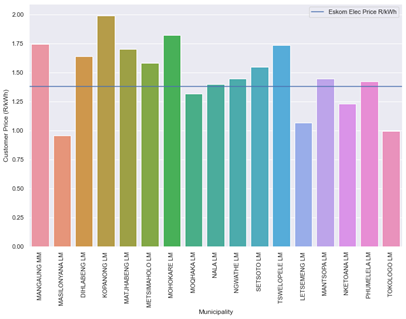
To arrive at the electricity prices for municipal customers, the electricity sales were divided by the total consumption, accounting for 10% of technical losses. If the consumption is significantly higher than the electricity sales, the municipality will have a very low R/kWh price which does not consider the non-technical losses experienced by municipalities. To find a better estimate of electricity prices per municipality, municipalities having a markup of 1,4 or greater were assumed to have 10% total losses (technical and non-technical losses). Municipalities with a markup between 1 and 1,4 were assumed to have 15% losses and those with a markup that is less than 1 were assumed to have 20% total losses. Even with these assumptions in place, there were some municipalities that had an electricity price markup that is lower than their NERSA approved price, which might be an indication of higher non-technical losses than those assumed in this study.
With the assumptions made, the estimated average price of customers in Free State municipalities, which is the province with the highest amount of electricity overdue debt in South Africa, is shown in Figure 14. From Figure 14, of the five municipalities that have an electricity resale price that is lower than the Eskom price, Masilonyana and Tokologo local municipalities each have an estimated price that is lower than their NERSA approved electricity price, and overdue debt ranging from R78 to R124 million, while municipalities with a higher electricity price such as Kopanong and Mohokare local municipalities, have overdue debts ranging from R600 000 to R3,9 million.
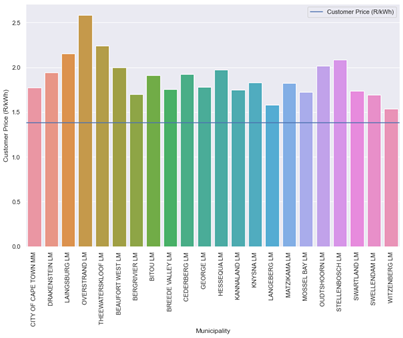
All the municipalities that have been sampled in the Western Cape province have estimated average electricity prices that are above the Eskom residential and commercial price as shown in Figure 15.
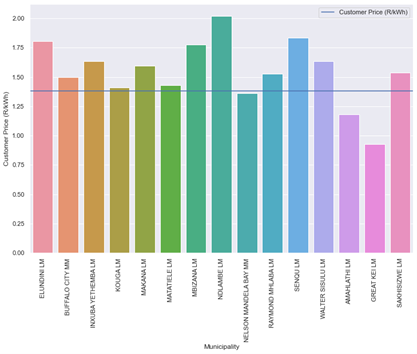
The Eastern Cape province has the lowest average electricity price markup but only has the third lowest overdue debt. A breakdown of the estimated electricity prices per municipality is given in Figure 16 and shows that only 20% of the sampled municipalities in the province have an electricity price that is lower than the Eskom electricity price. According to the assumptions made in this study, this is indicative of high total losses. In 2020 Nelson Mandela Bay metropolitan municipality had losses of over 20% of the total electricity purchased, with 14,3% of this being due to non-technical losses; this amounts to over R550 million of revenue lost by this municipality alone [12].
Other provinces experienced significant revenue losses due to both technical and non-technical losses, with Merafong City local municipality in Gauteng having the highest losses of over 33% of total electricity purchased [13]. Figure 17 shows estimated average prices for Gauteng municipalities.
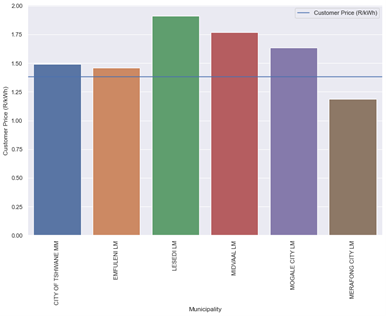
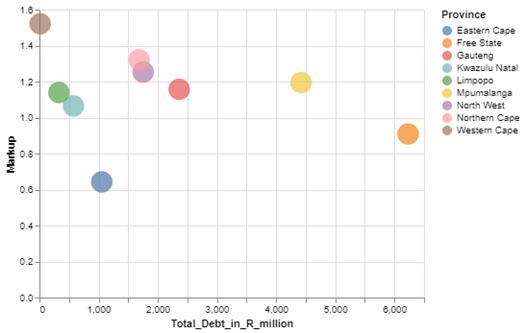
Figure 18 provides a picture of the relationship between electricity markups and the total debt per province. It can be seen that higher electricity markups are generally associated with lower overdue municipal debt to Eskom.
Average electricity price of well-performing local municipalities
In this analysis, municipalities that have zero to little debt are classified as well-performing municipalities. These municipalities have an average markup of 1,46 and have debt that is below R100 million. The ten municipalities with the lowest amount of debt excluding those with zero debt are shown in Figure 19, while the top ten municipalities with the highest debt in 2020 are shown in Figure 20. These two figures show that there is a correlation between the electricity markup charged by a municipality and a municipality’s overdue debt to Eskom.
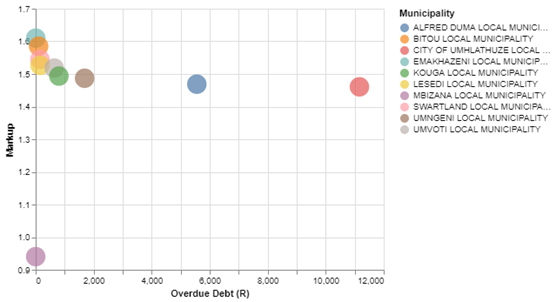
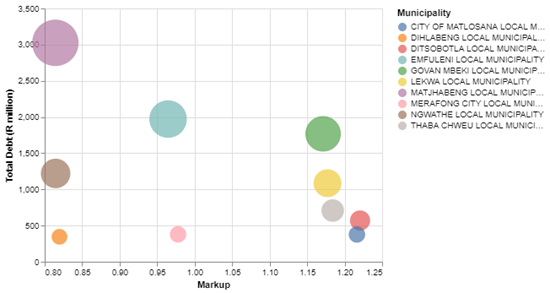
Solely using the electricity price per municipality as a measure for its performance would therefore not be accurate. Using the sales and purchases markup provides clearer insight as it shows the amount spent by municipalities to purchase electricity and the total amount paid by customers. A low markup shows that the municipality sold its purchased electricity at a loss, or that a municipality has very low electricity sales but might also mean poor administration by the municipality. A very low electricity price (R/kWh) might be an indicator of high levels of non-technical losses which can be defined as losses that are due to fraud, maladministration, non-paying customers, and electricity theft with the latter contributing 10% to total losses [14].
This article presented a comparison of municipal customers’ electricity prices, electricity price markups and the total overdue debt of municipalities to Eskom. The data from several sources, including Eskom and Statistics South Africa, have been analysed. The results presented show that a considerable number of municipalities have overdue debt to Eskom and are not making enough money from electricity sales to pay Eskom for electricity consumed by their municipality. The study also showed that municipalities experience quite significant losses, both technical and non-technical, due to deteriorated infrastructure, electricity theft and illegal tampering by customers.
It is clear from the analysis of municipal electricity sales that there is a wide disparity in the markups charged to municipal electricity customers, with markups ranging from 0.6 up to 2.5 times the purchase price. This means there is very poor price equality across municipal electricity customers in South Africa with some customers paying significantly more than others for electricity. The data also makes it very clear that municipalities have a high dependency on electricity revenue and that alongside the poor price equality there is a significant disparity in the financial health of municipal electricity departments.
References
|
[1] |
Statistics South Africa, “Community Survey 2016 Statistical Release,” 2016. [Online]. Available: http://cs2016.statssa.gov.za/wp-content/uploads/2016/07/NT-30-06-2016-R…. [Accessed 20 January 2023]. |
|
[2] |
G. Steyn, “Administered prices, Electricity - A report for National Treasury,” South African National Treasury, 2004. |
|
[3] |
U. Minnaar, M. Van Zyl and M. Hicks, “Applied SARIMA Models for Forecasting Electricity Distribution Purchases and Sales,” Cigre Science and Engineering, no. March, 2023. |
|
[4] |
South African Local Government Association v Eskom and others, 2021. |
|
[5] |
Statistics south Africa, “Financial census of municipalities for the year ended 30 June 2021,” Statistics south Africa, Pretoria, 2021. |
|
[6] |
M. Orlandi and R. Amra , “Understanding the sources,” Parliamentary Budget Office, Parliament of the Republic of South Africa, Cape Town, 2021. |
|
[7] |
R. Eberhard, “The municipal electricity industry - key dynamics with a focus on the metros,” South African National Treasury, Pretoria, 2018. |
|
[8] |
Auditor-General South Africa, “Great Kei Local Municipality Audit Report for the Year Ended June 2020,” Auditor-General South Africa, East London, 2021. |
|
[9] |
Department of Public Enterprises, “Roadmap for Eskom in a Reformed Electricity Supply Industry,” Department of Public Enterprises, Pretoria, 2019. |
|
[10] |
R. Goode, “Municipal Power Procurement and Generation,” Development Bank of South Africa (DBSA), Pretoria, 2020. |
|
[11] |
Auditor General South Africa, “Report of the auditor general to the Eastern Cape Provincial legislature and the council on Nelson Mandela Bay Metropolitan Municipality and its municipal entity. Report on the audit of the consolidated and separate financial statements.,” Auditor-General South Africa, East London, 2021. |
|
[12] |
Auditor-General of South Africa, “Report of the Auditor-General to Gauteng Provincial Legislature for the audit of Merafong City Local Municipality. Report on the audit of the financial statements.,” Auditor-General of South Africa, Gauteng, 2021. |
|
[13] |
Q. E. Louw, “Impact of Non-technical Losss: A South African Perspective Compared to Global Trends,” SARPA Johannesburg, pp. 1-7, 2019. |
|
[14] |
N. O. Shokoya and A. K. Raji, “Electricity theft: a reason to deploy smart grid in South Africa,” International Conference on the Domestic Use of Energy (DUE) , pp. 96-101, 2019. |
Send your comments to rogerl@nowmedia.co.za
